
As scientific research advances, it is becoming clearer that air pollution is responsible for a growing range of health effects. Air quality in Switzerland continues to improve, as shown by air pollution maps produced by the Federal Office for the Environment (FOEN [3]). These FOEN maps are based on model calculations combined with data from monitoring stations. The air quality data shown in a GeoDa housing report (for a given address) reflect yearly averages from the most recent 2023 FOEN maps[3].
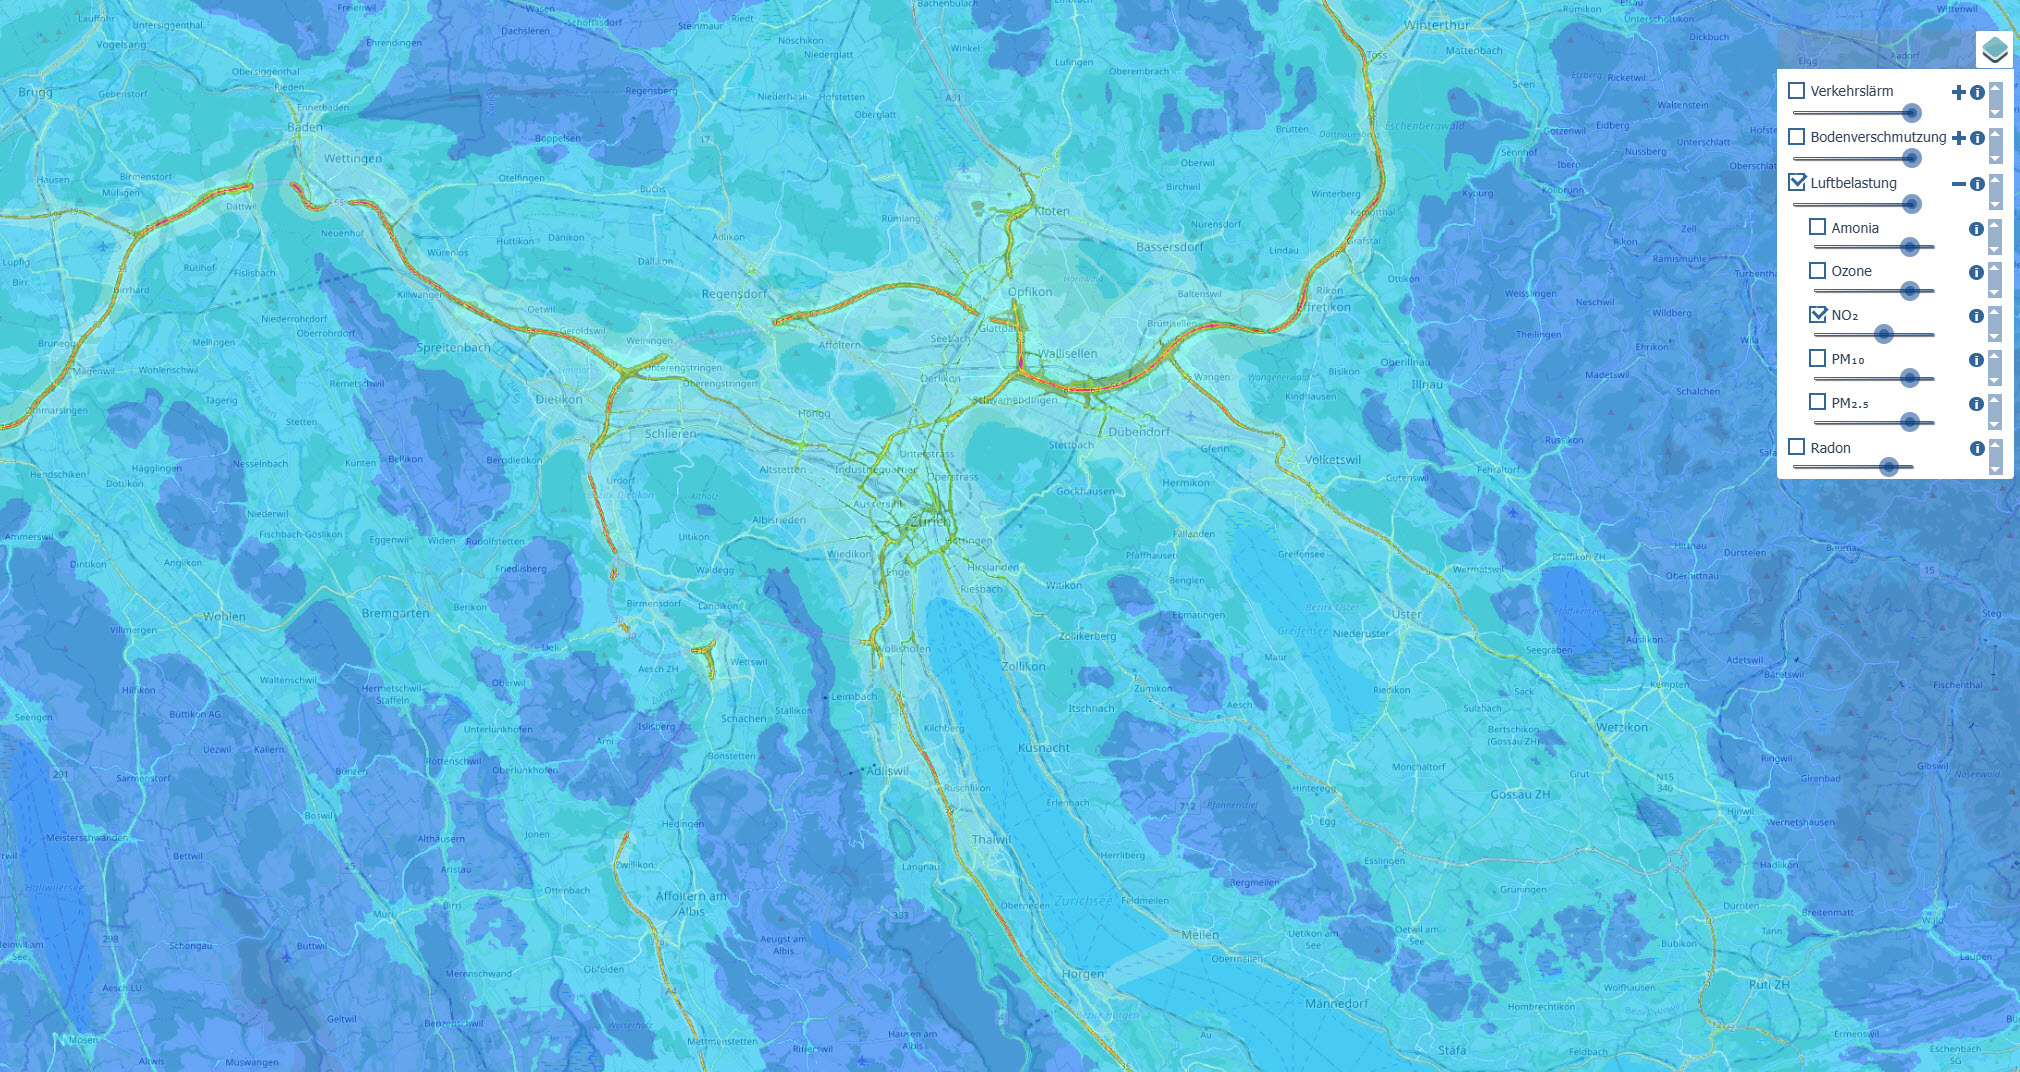
For each GeoDa.ch address there is an interactive map of air pollutants at and near the address. Map data from FOEN [3].
Main drivers in Switzerland are transport and heating (fossil fuels), with additional regional and imported contributions. Domestic electricity is relatively clean (≈62% hydro, ≈29% nuclear) [4]. Topography can trap polluted air; winter inversions and valleys reduce dispersion.
Air pollutants
GeoDa.ch provides address-level estimates of the following air pollutants fine particles (PM₂.₅), coarse particles (PM₁₀), ozone (O₃), nitrogen dioxide (NO₂), and ammonia (NH₃) across Switzerland. Below we explain the values, their health impacts, and the relevant thresholds.
| Pollutant | WHO Thresholds | Switzerland Thresholds | EU Thresholds | Switzerland Population average | Switzerland Attributable deaths |
|---|---|---|---|---|---|
| PM₂.₅ | 5 µg/m³[5] | 10 µg/m³[6] | 20 µg/m³[8] | 8.6 µg/m³[2] | 1,900[2] |
| PM₁₀ | 15 µg/m³[5] | 20 µg/m³[6] | 40 µg/m³[8] | - | - |
| NO₂ | 10 µg/m³[5] | 30 µg/m³[6] | 40 µg/m³[8] | 14.1 µg/m³[2] | 610[2] |
| Ozone | 60 µg/m³[5] | 100 µg/m³[6] | 120 µg/m³[8] | 100 µg/m³[2] | 1,250[2] |
| Ammonia | - | - | - | - | - |
PM₂.₅ (fine particles)
Fine particulate matter (PM₂.₅) consists of tiny particles or droplets in the air that are 2.5 micrometers or smaller. Because of their small size, these particles can lodge deeply in the lungs and some may even enter the bloodstream. PM₂.₅ is a complex mixture that can include acids (nitrates and sulfates), organic chemicals, metals, soil or dust particles, and allergens (such as pollen or mold fragments). Main sources include combustion activities such as motor vehicles, power plants, residential wood burning, wildfires, agricultural burning, and some industrial processes.[1]
PM₁₀ (coarse particles)
Coarse particulate matter (PM₁₀) consists of inhalable particles with diameters generally 10 micrometers and smaller. These particles can include dust, pollen, and mold spores, and are primarily produced by mechanical processes such as crushing, grinding, or dust‑stirring activities. PM₁₀ can penetrate the respiratory system and cause health problems, particularly in people with asthma or other respiratory conditions.
NO₂ (nitrogen dioxide)
A reddish-brown, pungent gas produced by high-temperature combustion (traffic, diesel especially; boilers; industry). Indoors, gas stoves can be a significant source. NO₂ inflames the airways, worsens asthma, increases infections in children, and serves as a precursor to ozone and secondary PM₂.₅ (via nitrate).
O₃ (ozone)
Not emitted directly—forms in sunlight from NOₓ + VOCs (traffic, solvents, industry, wildfire smoke). Levels peak on warm, sunny afternoons and can be higher downwind of cities. A powerful oxidant that reduces lung function, causes chest tightness, coughing, wheeze, and triggers asthma; also damages vegetation/crops.
Ammonia (NH₃)
A sharp-smelling, alkaline gas emitted mainly by agriculture (manure and fertilizer). In air it reacts with nitric and sulfuric acids to form ammonium nitrate/sulfate, which are major components of PM₂.₅. At high levels it irritates eyes and airways; environmentally, NH₃ drives eutrophication and ecosystem damage. (Most regulations target emissions of NH₃ rather than ambient limits.)